|
Table of Contents |
|
Cassini At Titan
|
|
Saturn's Moons |
|
Atlas,
Calypso,
Dione,
Enceladus,
Epimetheus,
Helene,
Hyperion,
Iapetus,
Janus,
Mimas,
Pan,
Pandora,
Phoebe,
Prometheus,
Rhea,
Telesto,
Tethys,
Titan,
Possible New Satellites |
|
Saturn Science |
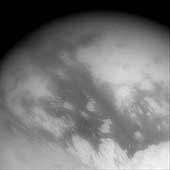
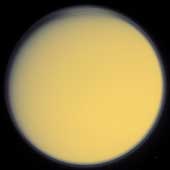
 Titan's Night Side
This image of Titan's night side was taken during Cassini's very close
flyby of the smoggy moon on Feb. 15, 2005.
The image shows Titan's thick atmosphere illuminated from behind by sunlight. A detached haze layer is visible over the entire globe. The haze layer over the north polar region (at the top) has an unusual structure, a feature that imaging scientists have noticed in earlier flybys but do not yet fully understand.
The image was taken with the Cassini spacecraft wide angle camera through
a filter sensitive to wavelengths of visible blue light centered at 460
nanometers. The image was acquired at a distance of approximately 134,000
kilometers (83,000 miles) from Titan and at a Sun-Titan-spacecraft, or
phase, angle of 158 degrees. Resolution in the image is about 8 kilometers
(5 miles) per pixel.
(Courtesy NASA/JPL/Space Science Institute)
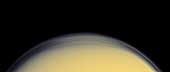
 Titan's Waves?
Multiple upper stratospheric haze layers are evident in this ultraviolet
view from Cassini looking toward Titan's south pole. The alternating bright
and dark bands may be due to differing haze concentrations produced by what
may be gravity wave motions (the atmospheric equivalent of ripples on a pond),
or perhaps they are evidence of shadows cast by haze layers moving upward as
waves pass by in the atmosphere. East-west waves suggestive of other wave
motions are also visible in these layers.
The image was taken with the Cassini spacecraft narrow angle camera on Feb.
14, 2005, through a filter sensitive to wavelengths of polarized infrared
light centered at 338 nanometers. The image was acquired at a distance of
approximately 151,000 kilometers (94,000 miles) from Titan and at a
Sun-Titan-spacecraft, or phase, angle of 20 degrees. Resolution in the image
is about 900 meters (3,000 feet) per pixel.
(Courtesy NASA/JPL/Space Science Institute)
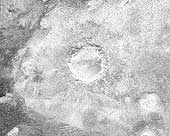 Impact Crater with Ejecta Blanket
This image shows a crater, approximately 60 kilometers (37 miles) in
diameter, on the very eastern end of the radar image strip taken by the
Cassini orbiter on its third close flyby of Titan on Feb. 15.
The appearance of the crater and the extremely bright (hence rough) blanket of material surrounding it is indicative of an origin by impact, in which a hypervelocity comet or asteroid, in this case, roughly 5-10 kilometers (3-6 miles) in size, slammed into the surface of Titan.
The bright surrounding blanket is debris, or ejecta, thrown out of the
crater. The asymmetric appearance of this ejecta blanket could be an
effect of atmospheric winds associated with the impact itself. Although
clearly formed by impact, the feature lacks a central peak, suggesting
that it has been eroded or otherwise modified after formation. Rainfall,
wind erosion, and softening of the solid material in which the crater
formed are all possible processes that might have altered this impact
feature.
(Courtesy NASA/JPL)
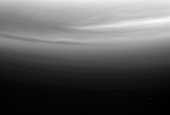
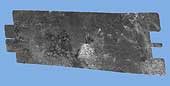
 Cat Scratches
This image is a portion of the swath acquired by the Cassini Titan radar
mapper on Feb. 15, 2005, on the mission's second opportunity to image the
surface with radar.
The frame, measuring about 300 kilometers (186 miles) from top to bottom, shows an area near the northeast corner of the large optically bright region named Xanadu.
Running across the image are a series of roughly parallel, mostly east-west dark linear features that join and separate, which are not seen in the previous radar images. They may be formed by the action of eastward-flowing winds, or geologic processes acting on the crust itself. In places they cut through adjacent terrain, while elsewhere the lineaments seem to be interrupted by brighter material, appearing again on the other side. Seams between radar segments are visible as horizontal, sawtooth-shaped lines.
Bright material in radar images may be rough or sloped toward the radar
(which is observing from the top in this frame). Also, some of what is
seen may in fact be below the surface, revealed as the radio waves
penetrate overlying, radar-transparent material.
(Courtesy NASA/JPL)
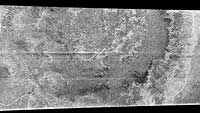 Circus Maximus
A huge annular feature with an outer diameter of approximately 440
kilometers (273 miles) appears in this image taken with Cassini's Titan
radar mapper. It resembles a large crater or part of a ringed basin,
either of which could be formed when a comet or asteroid tens of
kilometers in size slammed into Titan. This is the first impact feature
identified in radar images of Titan.
The surface of Titan appears to be very young compared to other Saturnian satellites. In Titan's case, debris raining down from the atmosphere or other geologic processes may mask or remove the craters. The pattern of brightness suggests that there is topography associated with this feature; for example, in the center of the image there appear to be mounds each about 25 kilometers (15 miles) across. Since they are dark on their lower edges that face away from the radar and bright on the opposite face, they must be elevated above the surrounding terrain.
This image is a part of a larger swath acquired on Feb. 15, 2005, on
Cassini's second opportunity to map Titan's surface via radar. Seams
between radar segments are visible as horizontal, sawtooth-shaped lines.
(Courtesy NASA/JPL)
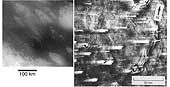 Titan Vs. Mars
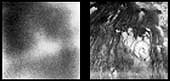
This image compares streaked terrain on Titan and Mars. At left is an
image from Cassini of the region where the Huygens probe is expected to
land. At right is a picture from NASA's Viking 1 orbiter, showing streaks
on Mars caused by winds blowing from right to left. The streaks at the
Huygens landing site were formed by some kind of fluid, possibly wind,
moving from the upper left to lower right (west to east).
The Cassini image was taken on Oct. 26, 2004, by the spacecraft's imaging
science subsystem using near-infrared filters. North is 45 degrees to the
right of vertical. The scale of this image is 0.83 kilometers (.52 miles)
per pixel.
(Courtesy NASA/JPL/Space Science Institute)
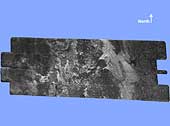 Diversity on Titan
This radar image of the surface of Saturn's moon Titan was acquired on
October 26, 2004, when the Cassini spacecraft flew approximately 1,200
kilometers (745 miles) above the surface and acquired radar data for the
first time. It reveals a complex geologic surface thought to be composed
of icy materials and hydrocarbons.
A wide variety of geologic terrain types can be seen on the image; brighter areas may correspond to rougher terrains and darker areas are thought to be smoother. A large dark circular feature is seen at the western (left) end of the image, but very few features resembling fresh impact craters are seen. This suggests that the surface is relatively young. Enigmatic sinuous bright linear features are visible, mainly cutting across dark areas.
The image is about 150 kilometers (93 miles) wide and 250 kilometers (155 miles) long, and is centered at 50 N, 82 W in the northern hemisphere of Titan, over a region that has not yet been imaged optically. The smallest details seen on the image are about 300 meters (984 feet) across.
The data were acquired in the synthetic aperture radar mode of Cassini's
radar instrument. In this mode, radio signals are bounced off the surface
of Titan.
(Courtesy NASA/JPL)
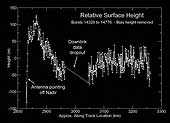 Topography on Titan
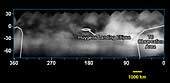
This graph, produced using preliminary altimetry data from Cassini's
radar instrument, shows relative surface heights on Titan. The data were
acquired on Oct. 26, 2004, during Cassini's first close encounter with
Titan, at distances ranging from 5,000 to 10,000 kilometers (3,100 to
6,200 miles). The location observed is near latitude 25 degrees north,
longitude 5 degrees west.
The data show a variation in height of only about 150 meters (490 feet)
over the 400-kilometer-long (250-mile-long) track, indicating that in
this region Titan is remarkably flat. Fine details in the data are likely
to be noise, and not surface features. The area marked "downlink data
dropout" was lost during transmission from the spacecraft to Earth but
will be recovered by a later data replay.
(Courtesy NASA/JPL)
 Two Views of Titan's Haze
These images show two views of Titan's planet-wide stratospheric haze
just before (left) and after (right) Cassini's first close encounter with
the shrouded moon. The image on the left was taken on Oct. 25, 2004,
through an ultraviolet filter, which is sensitive to scattering of
sunlight by small haze particles. It shows the high-altitude haze at the
north pole (top) illuminated above a surface blanketed in darkness during
this winter season. Numerous striations are visible in the haze,
indicating either waves passing through the layer or the presence of
multiple layers. The pixel scale of this image is 2.8 kilometers (1.7
miles).
The image on the right was taken on Oct. 26, 2004, and shows Titan's
night-side backlit by the Sun after Cassini's closest approach to the
moon. The haze layer ringing the planet is illuminated because the small
particles scatter significant sunlight in the forward direction.
Variations in haze concentration and thickness around the globe are also
evident and seem to be symmetric around the north pole (upper left). The
pixel scale of this image is 6.6 kilometers (4.1 miles).
(Courtesy NASA/JPL/Space Science Institute)
 Titan's Whispers
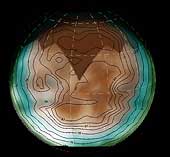
This image shows Titan data from the passive radiometer mode of Cassini's
radar instrument overlaid onto a visible-light image mosaic from the
spacecraft's imaging science subsystem. The contours and colors show
Titan's radiation at microwave wavelengths (about two centimeters or 0.79
inch), while the light and dark shading is from the optical image. This
microwave radiation comes directly from Titan itself, rather than being a
reflection from the Sun as detected in visible-light images.
The microwave brightness tells us about surface properties such as temperature composition and roughness. The brightness decreases when the angle of the surface is tilted from the viewer, causing the edges of Titan's disc to look dark relative to the center even though they are probably at the same temperature. Since the variations in brightness are likely larger than variations in physical temperature, they are probably due to compositional or structural properties of the surface.
There is a significant correlation between areas that are bright in the microwave and dark in the optical, and vice versa. Comparison of data sets will help determine the causes of these variations.
The radar data was taken on Oct. 26, 2004, during Cassini's first close
encounter with Titan. The imaging science subsystem data was acquired on
approach to the moon.
(Courtesy NASA/JPL)
 Titan's Tantalizing Streaks
This wide-angle image captured by Cassini's imaging science subsystem
shows streaks of surface material in the equatorial region of Titan. It
was acquired through a near-infrared filter, which is sensitive to
methane. Streaks occur in the east-west direction (upper left to lower
right), and may be caused by the movement of a fluid over the surface,
such as wind, hydrocarbon liquids, or a migrating ice sheet, such as a
glacier. The large-scale streaks are most easily explained by winds in
Titan's massive atmosphere. The image scale of this picture is 6
kilometers (3.7 miles) per pixel. North is 45 degree to the right of
vertical.
(Courtesy NASA/JPL/Space Science Institute)
 'Black Cat' on Titan
This radar image of the surface of Saturn's moon Titan was acquired on
October 26, 2004, when the Cassini spacecraft flew approximately 1,600
kilometers (994 miles) above the surface and acquired radar data for the
first time.
Brighter areas may correspond to rougher terrains and darker areas are thought to be smoother. This image highlights some of the darker terrain, which the Cassini team has nicknamed "Si-Si the Cat" after a team member's daughter, who pointed out its cat-like appearance. The interconnected dark spots are consistent with a very smooth or highly absorbing solid, or could conceivably be liquid.
The image is about 250 kilometers (155 miles) wide by 478 kilometers (297 miles) long, and is centered at 50 N, 54 W in the northern hemisphere of Titan, over a region that has not yet been imaged optically. The smallest details seen on the image vary from about 300 meters (984 feet) to 1 kilometer (.62 mile).
The data were acquired in the synthetic aperture radar mode of Cassini's
radar instrument. In this mode, radio signals are bounced off the surface
of Titan.
(Courtesy NASA/JPL)
 Titan's Complex Surface
This image taken by Cassini's visual and infrared mapping spectrometer
clearly shows surface features on Titan. It is a composite of false-color
images taken at three infrared wavelengths: 2 microns (blue); 2.7 microns
(red); and 5 microns (green). A methane cloud can be seen at the south
pole (top of image). This picture was obtained as Cassini flew by Titan
at altitudes ranging from 100,000 to 140,000 kilometers (88,000 to 63,000
miles), less than two hours before the spacecraft's closest approach. The
inset picture shows the landing site of Cassini's piggybacked Huygens
probe.
(Courtesy NASA/JPL/University of Arizona)
 Behold Titan's Surface
These images show the surface of Titan at two different infrared
wavelengths. They were captured by the visual and infrared mapping
spectrometer onboard Cassini as the spacecraft flew by at an altitude of
1200 kilometers (745 miles) - Cassini's closest approach yet to the hazy
moon. The image on the left, taken at a wavelength of 2 microns, is the
most detailed picture to date of the Titan's surface. It reveals complex
landforms with sharp boundaries, which scientists are eager to further
study. The image on the right was taken at a wavelength of 1 micron and
shows approximately what a digital camera might see.
(Courtesy NASA/JPL/University of Arizona)
 Case of the Lost Atmosphere
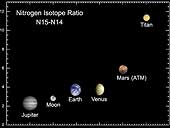
This graph shows data acquired by Cassini as it flew by Titan at an
altitude of 1,200 kilometers (745 miles) on Oct. 26, 2004 - its closet
approach yet to the hazy moon. The data is from Cassini's ion and neutral
mass spectrometer, which detects charged and neutral particles in the
atmosphere. The graph shows that the amount of light nitrogen in the
atmosphere of Titan is much less than that around other planets.
Scientists believe this nitrogen was lost over large geologic times
scales for reasons that remain unknown.
(Courtesy NASA/JPL/UC Berkeley)
 Eyes on Xanadu
This image taken on Oct. 24, 2004, reveals Titan's bright
"continent-sized" terrain known as Xanadu. It was acquired with the
narrow angle camera on Cassini's imaging science subsystem through a
spectral filter centered at 938 nanometers, a wavelength region at which
Titan's surface can be most easily detected. The surface is seen at a
higher contrast than in previously released imaging science subsystem
images due to a lower phase angle (Sun-Titan-Cassini angle), which
minimizes scattering by the haze.
The image shows details about 10 times smaller than those seen from
Earth. Surface materials with different brightness properties (or
albedos) rather than topographic shading are highlighted. The image
has been calibrated and slightly enhanced for contrast. It will be
further processed to reduce atmospheric blurring and to optimize mapping
of surface features. The origin and geography of Xanadu remain mysteries
at this range. Bright features near the south pole (bottom) are clouds.
On Oct. 26, Cassini will acquire images of features in the central-left
portion of this image from a position about 100 times closer.
(Courtesy NASA/JPL/Space Science Institute)
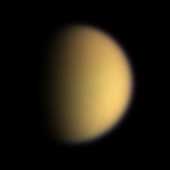
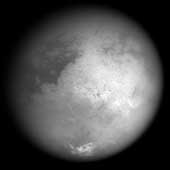
 Seasonal Differences
Cassini's finely tuned vision reveals seasonal differences in the global
haze that envelopes Titan in this narrow angle camera image taken on Oct.
24, 2004. The picture was taken through a filter sensitive to strong
absorption by methane gas (wavelengths centered at 889 nanometers). Here,
the northern hemisphere of Titan is notably brighter than the southern
hemisphere, because there is more haze in the north. The presence of haze
in the northern hemisphere was also observed in images returned by NASA's
Voyager spacecraft in 1981. The haze distribution was reversed, north to
south, in observations taken by NASA's Hubble Space Telescope from 1994
to 2000.
The image was taken from a distance of 1.08 million kilometers (675,000
miles) from Titan. The image scale is 6.52 kilometers (4.05 miles) per
pixel.
(Courtesy NASA/JPL/Space Science Institute)
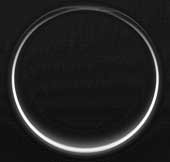
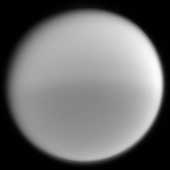
 High Haze in Color
A global detached haze layer and discrete cloud-like features high above
Titan's northern terminator (day-night transition) are visible in this
image acquired on October 24, 2004, as the Cassini spacecraft neared its
first close encounter with Titan. This full disk view of Titan is a
colorized version of the ultraviolet image released on October 25, 2004
(PIA06120). The globe of Titan and the haze have been given colors that
are close to what the natural colors are believed to be.
The image was acquired at a distance of about 1 million kilometers
(621,371 miles) in a near ultraviolet filter that is sensitive to
scattering by small particles. The Sun preferentially illuminates the
southern hemisphere at this time; the north polar region is in darkness.
The well-known global detached haze layer, hundreds of kilometers above
Titan's surface, is produced by photochemical reactions and visible as a
thin ring of bright material around the entire planet. At the northern
high-latitude edge of the image, additional striations are visible,
caused by particulates that are high enough to be illuminated by the Sun
even though the surface directly below is in darkness. These striations
may simply be caused by a wave propagating through the detached haze, or
they may be evidence of additional regional haze or cloud layers not
present at other latitudes.
(Courtesy NASA/JPL/Space Science Institute)
 High Haze in Color (Close-up)
A global detached haze layer and discrete cloud-like features high above
Titan's northern terminator (day-night transition) are visible in this
close-up image acquired on October 24, 2004, as the Cassini spacecraft
neared its first close encounter with Titan. This image is a colorized
version of an ultraviolet image released on October 25, 2004 (PIA06120).
The haze has been given colors that are close to what the natural colors
are believed to be. The view was also sharpened to enhance the structure
in the discrete features.
The image was acquired at a distance of about 1 million kilometers
(621,371 miles) in a near ultraviolet filter that is sensitive to
scattering by small particles. The Sun preferentially illuminates the
southern hemisphere at this time; the north polar region is in darkness.
The well-known global detached haze layer, hundreds of kilometers above
Titan's surface, is produced by photochemical reactions and is visible as
a thin ring of bright material around the entire planet. At the northern
high-latitude edge of the image, additional striations are visible,
caused by particulates that are high enough to be illuminated by the Sun
even though the surface directly below is in darkness. These striations
may simply be caused by a wave propagating through the detached haze, or
they may be evidence of additional regional haze or cloud layers not
present at other latitudes.
(Courtesy NASA/JPL/Space Science Institute)
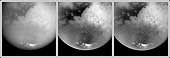 Revealing Titan's Surface
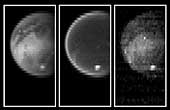
These three pictures were created from a sequence of images acquired by
Cassini's imaging science subsystem on Oct. 25, 2004, 38 hours before its
closest approach to Titan. They illustrate how the details of Titan's
surface can be revealed through image processing techniques.
The picture on the left is a single image that has undergone only basic cleaning of corrupted pixels and imperfections in the camera's charge coupled device, a light-sensitive detector similar to those found in digital cameras. In the middle frame, multiple images were used to enhance the contrast detected from Titan's surface and to reduce the blurring effect of atmospheric haze. The picture on the right has been further processed to sharpen the edges of features.
The processed images reveal sharp boundaries between dark and light regions on the surface; there are no shadows produced by topography in these images. The bright area on the center right is Xanadu, a region that has been observed previously from Earth and by Cassini. To the west of Xanadu lies an area of dark material that completely surrounds brighter features in some places. Narrow linear features, both dark and bright, can also be seen. It is not clear what geologic processes created these features, although it seems clear that the surface is being shaped by more than impact craters alone. The very bright features near Titan's south pole are clouds similar to those observed during the distant Cassini flyby on July 2, 2004.
The region on the left side of these images will be targeted by higher-resolution observations as Cassini passes close to Titan on Oct. 26, 2004.
All of these images were acquired by Cassini on Oct. 25, 2004, at an
altitude of 702,000 kilometers (436,000 miles) and a pixel scale of 4.2
kilometers (2.6 miles). The Sun was illuminating Titan from nearly behind
the spacecraft.
(Courtesy NASA/JPL/Space Science Institute)
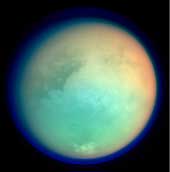 Titan in False Color
This image shows Titan in ultraviolet and infrared wavelengths. It was
taken by Cassini's imaging science subsystem on Oct. 26, 2004, and is
constructed from four images acquired through different color filters.
Red and green colors represent infrared wavelengths and show areas where
atmospheric methane absorbs light. These colors reveal a brighter (redder)
northern hemisphere. Blue represents ultraviolet wavelengths and shows
the high atmosphere and detached hazes.
Titan has a gigantic atmosphere, extending hundreds of kilometers above
the surface. The sharp variations in brightness on Titan's surface (and
clouds near the south pole) are apparent at infrared wavelengths. The
image scale of this picture is 6.4 kilometers (4 miles) per pixel.
(Courtesy NASA/JPL/Space Science Institute)
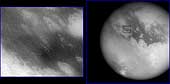 Huygen's Landing Site
Shown here are two images of the expected landing site of Cassini's
Huygen's probe (latitude 10.6 S, longitude 191 W). At right is a
wide-angle image showing most of Titan's disc, with a scale of 10
kilometers (6.2 miles) per pixel. At left is a narrow-angle image of the
landing site at a scale of 0.83 kilometers (.5 miles) per pixel (location
shown by black box at right). North is tilted about 45 degrees from the
top of both images. The surface has bright and dark markings with a
streamlined pattern consistent with motion from a fluid, such as the
atmosphere, moving from west to east (upper left to lower right). The
image at left is 400 kilometers (249 miles) wide. Both images were taken
by Cassini's imaging science subsystem through near-infrared filters.
(Courtesy NASA/JPL/Space Science Institute)
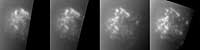
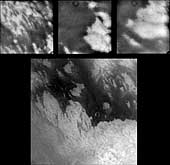 Titan Close-Ups
These images, taken during Cassini's first close flyby of Titan, show
details never before seen on Titan's mysterious surface.
The large, bottom image shows a complex interplay between dark and bright material on Titan's surface. This image was taken at a range of about 340,000 kilometers (211,000 miles), and the entire view is approximately 2,000 kilometers (1,200 miles) across. The surface appears to have been shaped by multiple geologic processes. Although a few circular features can be seen, there are no features that can be definitively identified as impact craters. Cassini scientists are studying these and other images acquired during the flyby to understand the nature and origins of the intriguing features.
The three smaller images show details of some of the features seen within the larger scene. The image on the upper right shows a scene approximately 500 kilometers (311 miles) across in which bright and dark bands of material span east to west. The upper middle and upper right images show bright material surrounded by dark material in scenes approximately 300 kilometers (186 miles) across. Very narrow, dark bands can be seen crossing the bright terrain. These features are approximately 2 kilometers (1.2 mile) across and up to a few hundred kilometers long. The dark circular feature that appears at the top of each of the upper images is a camera artifact that was not removed by the preliminary image processing.
The tops of the images point to the northwest. The Sun is illuminating
Titan from nearly behind the spacecraft, and there are no shadows or
topographic shading visible in these images. All shading is due to
surface brightness contrasts. The images were captured by Cassini's
imaging science subsystem through near-infrared filters.
(Courtesy NASA/JPL/Space Science Institute)
 Lots of Hydrocarbons
This graph shows data acquired by Cassini as it flew by Titan at an
altitude of 1,200 kilometers (745 miles) on Oct. 26, 2004 -- its closet
approach yet to the hazy moon. The data is from Cassini's ion and neutral
mass spectrometer, which detects charged and neutral particles in the
atmosphere. The graph reveals a diversity of hydrocarbons in the high
atmosphere above Titan, including benzene and diacetylene.
(Courtesy NASA/JPL/UC Berkeley)
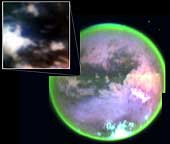
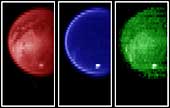
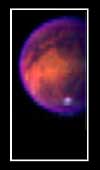
 Glowing Titan
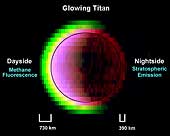
The glow of Titan's extensive atmosphere shines in false colors in this
view of Saturn's gas-enshrouded moon acquired by the Cassini spacecraft
visual and infrared mapping spectrometer during the July 2, 2004, flyby.
While flying over the terminator, where Titan's day and night meet, both the dayside and night sides are seen at various wavelengths. In these views of the crescent moon, the sunlit side is on the left and the nightside on the right. The blue image shows the sunlit crescent as observed at a wavelength that pierces through the thick atmosphere to show only the surface. This image is much smaller than the other three images to the right, because it does not show any atmospheric affects.
In contrast, the green image shows the immense size of Titan's atmosphere. This is revealed by the fluorescent glow of methane gas, which extends over 700 kilometers (435 miles) above the surface, showing that the atmosphere nearly doubles the size of Titan. This glow is at a wavelength of 3.3 microns, five times the wavelength visible to the human eye.
The red image shows that Titan also glows at night, which initially surprised scientists. The moon glows out to more than 200 kilometers (124 miles) in altitude, indicating carbon-monoxide emission at the 4.7 micron wavelength produced in Titan's relatively warm stratosphere.
The multicolor image on the far right combines the three previous images
into one composite. Here it is seen that the carbon monoxide glow extends
over the dayside as well, producing the yellow layer observed on the left. This is because the two glows, one from methane (green) and carbon monoxide (red) mix together to form yellow in this multi-color composite. Titan's surface is indicated by the circle. Titan's surface appears purple due to the mixing of the blue and red surface images.
(Courtesy NASA/JPL/University of Arizona)
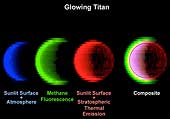
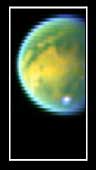
 Glowing Titan
The glow of Titan's extensive atmosphere shines in false colors in this
view of Saturn's gas-enshrouded moon acquired by the Cassini spacecraft
visual and infrared mapping spectrometer during the July 2, 2004, flyby.
This image is a combination of near-infrared colors, each of which probes
different phenomena in the moon.
From its vantage point over Titan's terminator, both the dayside and
nightside of the crescent moon are seen, with the sunlit side on the left.
In this false color rendition, green light is the fluorescent emission of
methane gas powered by sunlight, at a wavelength of 3.3 microns. This is
some five times the wavelength visible to the human eye. The glow extends
over 700 kilometers (435 miles) above the surface, revealing the unusual
thickness of the moon's atmosphere, which nearly doubles Titan's volume
compared to the volume of the solid sphere, indicated by the solid line.
On the nightside (right side), the moon glows red out for over 200
kilometers (125 miles) altitude, indicating carbon-monoxide emission at
4.7 micron wavelength produced in Titan's relatively warm stratosphere.
This glow actually extends over the dayside as well, producing the yellow
layer observed on the left as the two glows from methane (green) and
carbon monoxide (red) mix together in this rendition. Titan's surface is
indicated by the circle determined by a surface image at 2.0 microns
blue), which is unaffected by atmospheric glows showing the sunlit
surface. Here, due to the reddish glow of carbon monoxide overlying the
blue-colored surface, most of the dayside appears purplish in color.
(Courtesy NASA/JPL/University of Arizona)
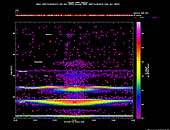
 Neutral Gas Cloud Around Titan
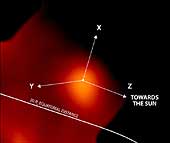
Images from the magnetospheric imaging instrument and the ion and neutral
camera onboard the Cassini spacecraft reveal aspects of the interactions
between Saturn's dynamic population of hot energetic ions and the clouds
of cold neutral atoms. Future observations may further explain the
relationships between these interactions.
The most recent image of Titan reveals the emission of high-speed neutral atoms from a globular region approximately 70,000 kilometers (43,496 miles) in diameter, clearly centered on Titan. It is only 1/25 as bright as the region seen toward dawn during Saturn orbit insertion, even though Cassini is now closer to Titan. There is an extended emission region around the Titan cloud, but it is much dimmer than the Titan cloud itself and even dimmer compared to the emission seen in the dawn direction at orbit insertion. In this image, the X marks the direction toward the Sun; the Y marks the direction toward Saturn's dawn; and the Z marks Saturn's rotation axis. The dot in the center marks Titan. (Courtesy NASA/JPL/JHU/APL/Max-Plank-Institut für Aeronomie/University of)
 Titan Map
This mosaic of images taken by the Cassini spacecraft as it approached
Saturn shows the surface features of Titan, from the dark "H" on the left
to the bright observation area at the south pole on the right. Visible in
the center is the location where the spacecraft's Huygens probe will
descend in January 2005.
(Courtesy NASA/JPL/Space Science Institute)
 Titan's Surface Revealed
Piercing the ubiquitous layer of smog enshrouding Titan, these images
from the Cassini visual and infrared mapping spectrometer reveals an
exotic surface covered with a variety of materials in the southern
hemisphere.
Using near-infrared colors -- some three times deeper in the red visible
to the human eye -- these images reveal the surface with unusual clarity.
The left image shows a variety of surface features at a wavelength of 2.0
microns. The darker areas are possibly regions of relatively pure water
ice, while the brighter regions likely have a much higher amount of
non-ice materials such as simple hydrocarbons. The middle image measured
at a wavelength of 2.8 microns shows a very dark surface almost
everywhere, as expected for a surface of water ice and simple
hydrocarbons. The image on the right, taken at 5.0 microns, is similar to
the left image, indicating dark icy regions and brighter hydrocarbon-rich
materials. A bright cloud of methane particles is apparent in all three
images near the south pole. It's persistence over an extensive range of
colors indicates that these cloud particles are large compared to the
typical haze particles surrounding the planet, suggesting a dynamically
active atmosphere near the South Pole.
(Courtesy NASA/JPL/University of Arizona)
 Titan's Surface Revealed
Piercing the ubiquitous layer of smog enshrouding Titan, these images
from the Cassini visual and infrared mapping spectrometer reveals an
exotic surface covered with a variety of materials in the southern
hemisphere.
Using near-infrared colors--some three times deeper in the red visible to the
human eye--these images reveal the surface with unusual clarity. The left
image shows a variety of surface features at a wavelength of 2.0 microns.
The darker areas are possibly regions of relatively pure water ice, while the
brighter regions likely have a much higher amount of non-ice materials such
as simple hydrocarbons. The middle image measured at a wavelength of 2.8
microns shows a very dark surface almost everywhere, as expected for a
surface of water ice and simple hydrocarbons. The image on the right, taken
at 5.0 microns, is similar to the left image, indicating dark icy regions and
brighter hydrocarbon-rich materials. A bright cloud of methane particles is
apparent in all three images near the south pole. It's persistence over an
extensive range of colors indicates that these cloud particles are large
compared to the typical haze particles surrounding the planet, suggesting a
dynamically active atmosphere near the South Pole. Color was used to
enhance the various wavelengths.
(Courtesy NASA/JPL/University of Arizona)
 Titan's Surface Revealed
Piercing the ubiquitous layer of smog enshrouding Titan, these images
from the Cassini visual and infrared mapping spectrometer reveals an
exotic surface covered with a variety of materials in the southern
hemisphere.
Using near-infrared colors -- some three times deeper in the red visible
to the human eye -- these images reveal the surface with unusual clarity.
The color image shows a false-color combination of the three previous
images (see PIA06405). The yellow
areas correspond to the hydrocarbon-rich regions, while the green areas
are the icier regions. Here, the methane cloud appears white, as it is
bright in all three colors.
(Courtesy NASA/JPL/University of Arizona)
 Titan's Surface Revealed
Piercing the ubiquitous layer of smog enshrouding Titan, these images
from the Cassini visual and infrared mapping spectrometer reveals an
exotic surface covered with a variety of materials in the southern
hemisphere.
Using near-infrared colors -- some three times deeper in the red visible
to the human eye -- these images reveal the surface with unusual clarity.
The color image shows a false-color combination of the three previous
images (see PIA06405).
(Courtesy NASA/JPL/University of Arizona)
 Titan's South Polar Clouds
This sequence of images illustrates the evolution of a field of clouds
near Titan's south pole over a period of almost five hours. The images
were acquired on July 2, 2004, by NASA's Cassini spacecraft at ranges of
364,000 to 339,000 kilometers (226,170 to 210,600 miles). These bright
clouds, believed to be composed of methane, appear in generally the same
area where Earth-based astronomers have previously detected clouds.
Cassini also saw clouds in this region during its approach to Saturn.
The pixel scale of these images ranges from 2.2 to 2.0 kilometers per
pixel (1.4 to 1.2 miles per pixel). The smallest features that can be
discerned in the clouds are roughly 10 kilometers ( 6 miles) across.
(Courtesy NASA/JPL/Space Science Institute)
 Closing in on Titan
Titan's veil begins to lift as Cassini's cameras peer through the hazy
moon.
This image acquired at a range of 344,000 kilometers (213,700 miles)
shows details at Titan's surface never seen before. The image shows only
surface brightness no topographic shading. The finest features are less
than 10 kilometers (6 miles) across. In other areas the surface boundaries
are less distinct perhaps due to different geologic process or atmospheric
effects. There are some linear features that could be impact craters but
the fact that many features are linear suggests that other geologic
processes are shaping the surface.
(Courtesy NASA/JPL/Space Science Institute)