|
COMETS EARTH JUPITER KUIPER BELT MARS MERCURY METEORITES NEPTUNE OORT CLOUD PLUTO SATURN SOLAR SYSTEM SPACE SUN URANUS VENUS ORDER PRINTS
PHOTO CATEGORIES SCIENCEVIEWS AMERICAN INDIAN AMPHIBIANS BIRDS BUGS FINE ART FOSSILS THE ISLANDS HISTORICAL PHOTOS MAMMALS OTHER PARKS PLANTS RELIGIOUS REPTILES SCIENCEVIEWS PRINTS
|
Related Document
Download Options
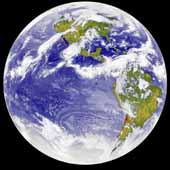
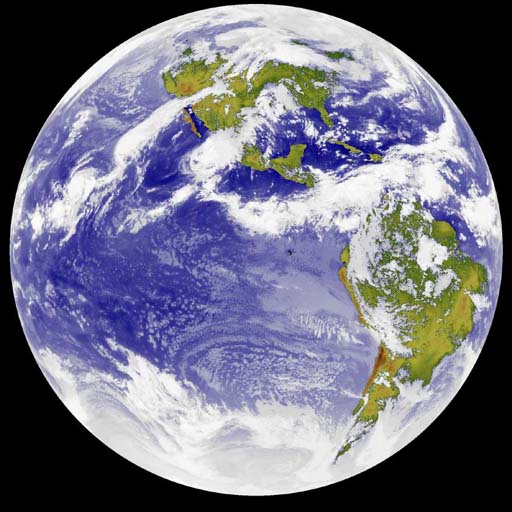
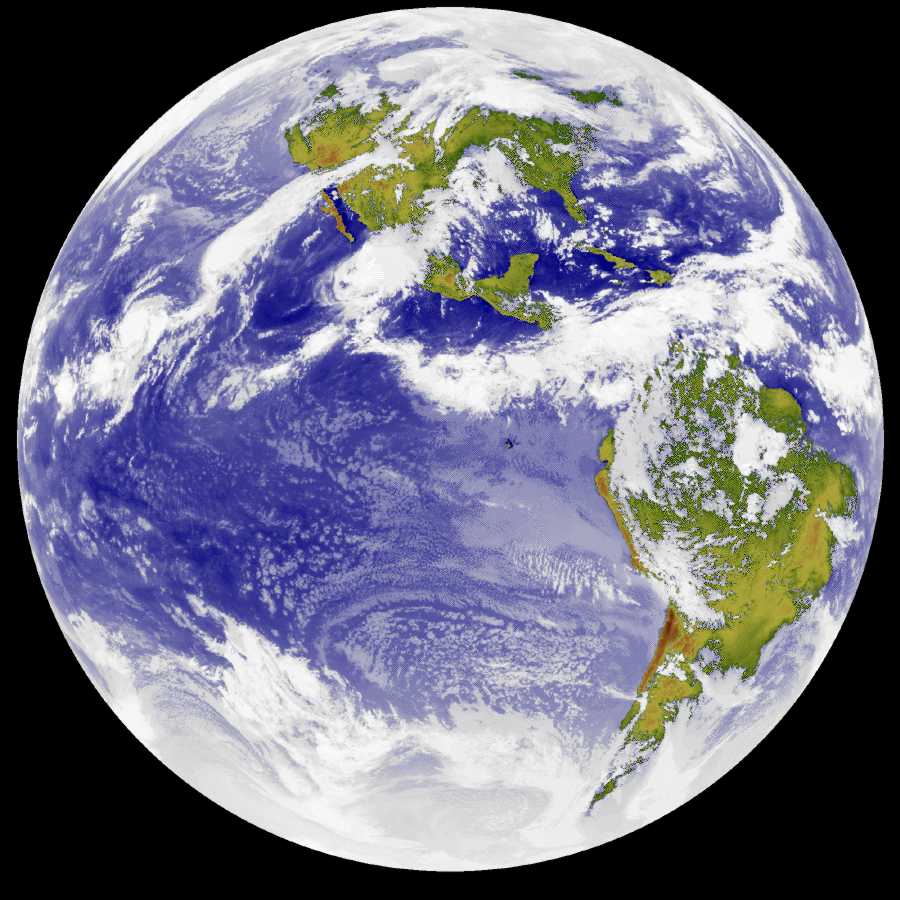
This is a 2000x2000 pixel full-disc 11.2um (infrared) image of the earth taken by the GOES 6 satellite on 21 September 1986 (Julian date 86264). The satellite sensor for that band registers 10 bits of data; this picture uses 8 bit data derived from the original by lopping off the 2 low-order bits. Rick Kohrs (rickk@ssec.wisc.edu) colored the image as follows. He used a threshold temperature to determine which pixels in the image corresponded to clouds. He then removed the cloud pixels from consideration. Since the temperatures over land and sea overlap, he used a base map to separate the remaining pixels into sea and land groups. At this point he had three partial images: (a) clouds, (b) unclouded sea, and (c) unclouded land. Based on temperatures he colored each of these separately using an appropriate fraction of the total number of cells available in an 8-bit color map. The combined image you see here uses the whole set of 256 colors. The date of the image is special. It is close to the equinox. This improves the temperature-based coloration as there are not so many wide temperature variations at that time of year. The reason the picture is from several years ago is that currently the "full disc" images the GOES 7 satellite sends do not include the poles. It lops them off an otherwise full disc. (This is not inherent in the satellite; it's what the ground station currently has it programmed to do.) One flaw we noticed after we finished the picture is that the cloud threshold value was such that parts of Canada have cloud colors rather than the land colors they probably should have. This is because those parts of Canada happened to be cold enough to look like clouds. Note that darker clouds are warmer, while lighter clouds are cooler. For instance, southeast of the Galapagos, just west of the coast of South America, there is a place where you can distinctly see multiple cloud layers, with the warmer clouds at lower altitudes (closer to the ocean that's warming them). The reason the picture uses an IR band image rather than the visible band image is that there is much more detail in the clouds. However, it is much easier to discriminate clouds from the surface in the visible band. In the future we'll work on better coloration using both the IR and visible data. Instead of using an IR threshold value to pick out the clouds in the IR image, we'll use a threshold value to pick out the clouds in the visible image, and then treat the corresponding pixels in the IR image as clouds. Another possible improvement is that we'll retain all 8 bits of the original pixel values in the three parts of the image, and use them with separate 8-bit color maps. Hopefully using 3*256 colors will reveal more detail in the image. (We have no specific deadline for doing these enhancements; it's mostly an off-hours project for us.) Rick Kohrs rickk@ssec.wisc.edu DaviD W. Sanderson dws@ssec.wisc.edu Space Science and Engineering Center University of Wisconsin-Madison (Image Credit: Space Science and Engineering Center, University of Wisconsin-Madison, Richard Kohrs, designer) |