


|
|
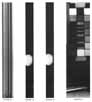
[120] The performance of the Viking cameras can be monitored in several different ways. The sensitivity of all 12 diodes is tested by flooding the photosensor array with light from a bulb directly above the array. The returned data are displayed as a series of bright vertical stripes, each stripe corresponding to the signal from one of the 12 diodes. Although the data are displayed here in conventional camera format (fig. 141), neither the vertical nor horizontal scanning mechanisms are used in this test.
The operation of the scanning mechanisms is tested by imaging two pointlight sources positioned one above the other in the fixed post against which the camera is stowed. Originally intended to be used prior to touchdown to confirm that the camera was operating properly, scan verification images have been used throughout the mission for completely different purposes. Figure 142 shows a scan verification image taken just before the transparent camera window was exposed to a jet of compressed CO2; figure 143 is a second scan verification picture taken just after this event. The similarity of the two pictures suggests that no dust was adhering to the window. If so, the lights in the post would have appeared brighter following the cleaning operation. Quantitative comparisons are made not from images but from computer printouts showing the pixel brightness values.
A more conventional camera test is imaging a target mounted on the spacecraft (fig. 144). Actually there are three identical targets, two of which are visible with either camera. Square patches of red, green, and blue paint assist in establishing color balance. A series of gray chips with varying brightness calibrate sensitivity of camera diodes and associated electronics. Groups of bare with different spacing indicate the camera's spatial resolution, much as we determine the quality of our own vision by reading progressively smaller symbols on an eye chart. A color picture of a test chart is shown in figure 184.
The properties of the test charts were measured carefully before they were mounted on the Lander, but their usefulness on Mars was limited by the fact that they were shadowed by spacecraft components-particularly the dishshaped S band antenna-through much of the martian day. During those times it was difficult to use reflectance values for calibration of associated images. In addition, dust accumulation o the charts, both from surface sampler activities and from atmospheric settling, diminished their usefulness.