|
COMETS EARTH JUPITER KUIPER BELT MARS MERCURY METEORITES NEPTUNE OORT CLOUD PLUTO SATURN SOLAR SYSTEM SPACE SUN URANUS VENUS ORDER PRINTS
PHOTO CATEGORIES SCIENCEVIEWS AMERICAN INDIAN AMPHIBIANS BIRDS BUGS FINE ART FOSSILS THE ISLANDS HISTORICAL PHOTOS MAMMALS OTHER PARKS PLANTS RELIGIOUS REPTILES SCIENCEVIEWS PRINTS
|
Related Document
Download Options
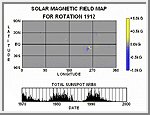
The Sun's magnetic field is the source of most (if not all) solar activity. The strength of the magnetic field is determined by variations in the polarization of light from different chemical elements in the Sun's atmosphere. As the Sun rotates once in about a month, observations of the Sun's magnetic field are combined to construct maps of the magnetic field at the Sun's surface. Maps from the National Solar Observatory for the previous 6 years are animated here to show the evolution of these magnetic field patterns. Yellow represents field coming "out" of the Sun (positive or North polarity) and blue represents field going "into" the Sun (negative or South polarity). The strip along the bottom indicates the date the map was taken by plotting the solar sunspot cycle up to that particular rotation of the Sun. This animation shows how active regions, places where magnetic fields erupt through the Sun's surface, decay as the field elements spread out across the surface. It shows that the latitude where activity occurs moves toward the Sun's equator as the sunspot cycle declines. Careful inspection also reveals differential rotation - regions near the equator drift to the right while regions above 30 degrees latitude drift to the left - and meridional flow - magnetic elements drift away from the equator and toward the poles. |
