|
COMETS EARTH JUPITER KUIPER BELT MARS MERCURY METEORITES NEPTUNE OORT CLOUD PLUTO SATURN SOLAR SYSTEM SPACE SUN URANUS VENUS ORDER PRINTS
PHOTO CATEGORIES SCIENCEVIEWS AMERICAN INDIAN AMPHIBIANS BIRDS BUGS FINE ART FOSSILS THE ISLANDS HISTORICAL PHOTOS MAMMALS OTHER PARKS PLANTS RELIGIOUS REPTILES SCIENCEVIEWS PRINTS
|
Related Document
Download Options
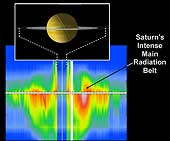
This graph shows the energetic ion and electron data from the Saturn orbit insertion interval on June 30 and July 1, 2004. Ion intensity is shown above the horizontal divider as energy increasing upward. Electron intensity is shown below the horizontal divider as energy increasing downward, as measured by the magnetospheric imaging instrument's low energy magnetospheric measurement system sensor onboard the Cassini spacecraft. Red indicates high particle intensity, blue is low intensity. The vertical energy scales run from 30 kilo-electron volts to several mega-electron volts. Time runs from left to right, with approximately 36 hours of data shown, covering a distance range from Saturn's center between 783,000 kilometers (487,000 miles) at either end, down to about 78,000 (49,000 miles) at closest approach. The region above the rings was found to be devoid of ions and electrons; the region inside the D-ring inner edge was not directly sampled and absent the magnetospheric imaging instrument ion and neutral camera remote sensing would have been assumed empty of energetic particles. |
