|
COMETS EARTH JUPITER KUIPER BELT MARS MERCURY METEORITES NEPTUNE OORT CLOUD PLUTO SATURN SOLAR SYSTEM SPACE SUN URANUS VENUS ORDER PRINTS
PHOTO CATEGORIES SCIENCEVIEWS AMERICAN INDIAN AMPHIBIANS BIRDS BUGS FINE ART FOSSILS THE ISLANDS HISTORICAL PHOTOS MAMMALS OTHER PARKS PLANTS RELIGIOUS REPTILES SCIENCEVIEWS PRINTS
|
Related Documents
Download Options
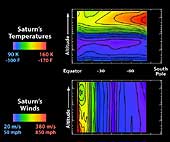
These graphs illustrate wind strength (bottom) and temperature above Saturn. The data were acquired by the Cassini spacecraft's composite infrared spectrometer when Saturn had just begun summer in its southern hemisphere. Altitude increases in the upward direction, and Saturn's south pole is to the right. The color red indicates higher temperatures, and stronger winds. As the top graph show, temperatures are cooler in the troposphere (the layer just above the cloud deck). In the upper stratosphere (the layer above the troposphere), temperatures increase toward the south pole. Temperature variation is muted in the upper troposphere. These observed temperature changes allow the east-west winds to be determined. The measured cloud-top winds from NASA's Voyager mission have also been used to create this wind plot. This is the first time that the stratospheric winds have been determined. They show a marked decline of about 140 meters per second (approximately 300 miles per hour) at low latitudes, moving from the cloud tops to higher levels. The origin of this decay, or wind speed reduction, is not known. Temperature maps obtained in the future from Cassini's new position in orbit around Saturn will have higher latitude resolution, and are expected to show more detail, helping us to unravel the riddles of Saturn's winds above the cloud tops. |
