|
COMETS EARTH JUPITER KUIPER BELT MARS MERCURY METEORITES NEPTUNE OORT CLOUD PLUTO SATURN SOLAR SYSTEM SPACE SUN URANUS VENUS ORDER PRINTS
PHOTO CATEGORIES SCIENCEVIEWS AMERICAN INDIAN AMPHIBIANS BIRDS BUGS FINE ART FOSSILS THE ISLANDS HISTORICAL PHOTOS MAMMALS OTHER PARKS PLANTS RELIGIOUS REPTILES SCIENCEVIEWS PRINTS
|
Related Document
Download Options
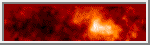
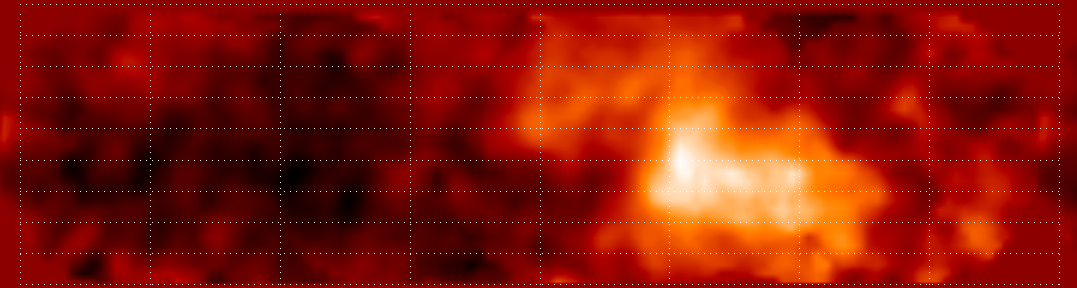
The latitude ranges from 40 deg South to 50 deg North, the longitude from 0 to 360 (E longitude increasing to the right, following the geographical--as opposed to astronomical--convention), with 180 in the center. The grid is 10 deg in latitude and 45 in longitude. The sub-Saturn point is at 0 E, 0 N, and the sub-Earth latitude is 7 N. The Huygens landing site (assuming October 1997 launch) is 18 N, 208 E. This is somewhat right of center in the map, and left of the main part of the bright region. The longitude is uncertain by 11 degrees due to our lack of knowledge about the winds on Titan -- how strong are they, and (more importantly), which way do they blow? We hope to be able to identify and track the motions of clouds as analysis of the entire HST Titan data set progresses. This map was made from the 14 F850LP images of Titan, which are primarily sensitive to the 0.94 micron methane window. At the beginning of our obsering period, the sub-Earth longitude was about 240 E. The first seven images were taken approximately every seven hours, and will be used to attempt to locate and track clouds in a sort of Titanian weather movie. During the time these first seven images were taken, the large bright feature slowly moved off of the observable disk. The next seven images were spaced about every 32 hours and gave us near complete coverage of the surface, with the exception of a 96 hour gap centered near 10 deg. The bright feature re-appeared in the last two images. To make the map, the haze background was subtracted from each image. The resulting images were individually projected onto a map, and they were then averaged to make what you see. Maps made from even and odd images in the sequence were compared against each other to verify that the larger and brighter features are all real, that is, observed in multiple images. Some of the brightness may be from clouds, and the smaller and less contrasty "features" are likely to be noise. Signal to noise in the original images was about 200:1, and the range of contrast shown is plus or minus about 4% from the mean. University of Arizona, News Services
(Science contacts:  Peter H. Smith, (602) 621-2725;
                    Mark Lemmon, (602) 621-1485;
                    UA Lunar and Planetary Laboratory)
|